Illustrations and Infographics
Distingué Marketing creates visual representations of abstract data to reinforced human cognition through illustrations and infographics. The abstract data include both numerical and non-numerical data, such as text and graphical information. Visual representations with familiar interaction techniques take advantage of the human eye’s broad bandwidth pathway into the mind to allow users to see, explore, and understand large amounts of information at once in intuitive ways.
Illustrations may be placed into paper documents, web pages, social media, digitally stored text, video, and other multi-media to convey a complex concept for better understanding and comprehension of the material.

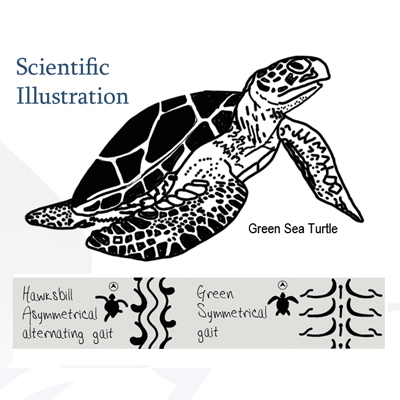
Technical Illustration and Scientific Illustration
Technical imagery Illustration communication generally tailors information to a specific audience, which may be subject matter experts, consumers, end users, children etc.
Technical Illustration communication often works collaboratively with informative wording to create deliverables for various media. Deliverables include online help, user manuals, technical manuals, white papers, specifications, process and procedure manuals, placed in industrial videos, reference cards, data sheets, journal articles, patents, training, business papers, technical reports, forms and documents.
Distingué Marketing works directly with engineers, scientists and/or company owners to represent the data in an illustration, in the most efficient way possible for your specific common consumer to understand and digest quickly.
Distingué Marketing ensures the technical illustrated content is designed clearly and concisely, and scientifically accurate.


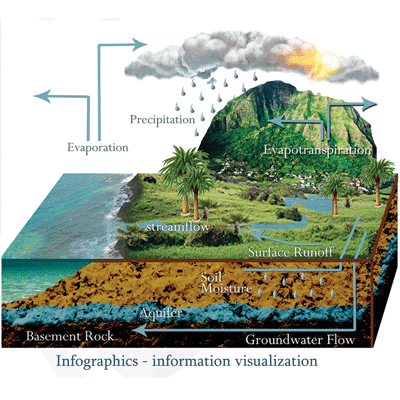
Infographic creation and Illustration

An infographic is a visual display of data that conveys and educates in an easily consumed format. Infographics can be used to promote, advertise and use as a highly efficient sales tool. It’s a quick and easy visual tool to give the target market plenty of compact information without requiring a lot of reading or words stated.
90% of information that’s transmitted to the brain is visual. Infographics take advantage of this to make that ultimate goal of the end user respond and understand. Well-created infographics are 30 times more likely to be understood and digested than any text.
Infographics are primarily used to educate. Whether that education is about a solution your company is offering to a complex problem, about your product or service or comparative between competitors. Because it’s visually compelling–at least effective infographics are–the target audience will walk away knowing something more about the subject at a quick glance. Distingue Marketing has expert graphic designers which are well versed in business acumen to convey complex data easily for your end user to consume ultimately allowing you to reach your goal with a smaller amount of effort.
